
Knowledge base
December 01, 2022
Power BI versus Tableau: which Business Intelligence Tool is right for you?
Choosing between two major business intelligence (BI) tools such as Microsoft Power BI and Tableau can be a difficult choice if you are unsure of their differences and applications.
In recent studies, more than half of executives surveyed did not believe they have the right technology to implement a digital transformation. One of the most important pieces of this digital transformation puzzle is choosing the right business intelligence tool and integrating it with an organization’s existing stack of available tools and technology.
As a business leader, finding the right business intelligence tool and empowering your business users can help you pave the way to growth and success. This article explores the two most popular business tools currently available on the market: Power BI and Tableau. The idea is not to say which tool is better among the two, but to help you understand which tool better suits your business requirements.
One Size Does not fit everyone
With numerous options available on the market today, choosing the right tool and technology can be a challenge for businesses. Answering the following questions can help you decide which tool fits your business requirements:
- What are the use cases your company wants to use to build visualizations?
- What do you want your visualizations to look like?
- How complex is your data?
- Who are the business users and how do they want to use and analyze the available data?
- Where are your data sources and how do they link together?
What is Power BI?
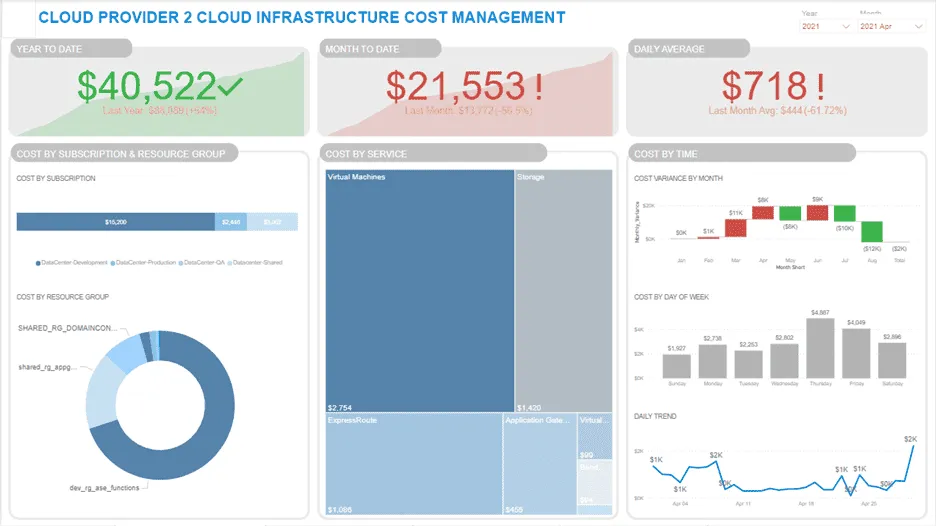
Power BI, launched by technology giant Microsoft in 2013, is an interactive and easy-to-use data visualization product from Microsoft’s Power Platform suite. Power BI is primarily focused on self-service and enterprise business intelligence.
Products offered by Power BI:
- Power BI Desktop-for data analysis and report design
- Power BI service: for collaboration and distribution of reports
- Power BI Mobile-system-specific mobile application
- Power BI Report Builder: for creating paginated reports
- Power BI Report Server-on-premises report server
- Power Query Editor-for data profiling and preparation
- Power BI Embedded: for embedding Power BI reports, dashboards and visuals in an application
What is Tableau?
Tableau is a powerful data visualization tool, originally developed in 2003 and later acquired by Salesforce in 2019. It can analyze large amounts of raw data that can be understood by professionals at all levels in an organization.
Products offered by Tableau:
- Tableau Desktop-for data analysis and report creation
- Tableau Server: on-premises and on-cloud options
- Tableau Reader-for viewing dashboards
- Tableau Mobile-mobile application
- Tableau Prep Builder-self-service ETL tool for cleaning, blending and transforming data for analysis
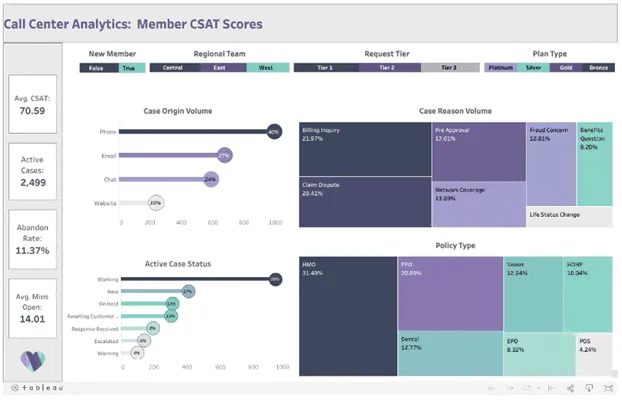
Example of tableau dashboard:
The road to choosing the right tool is not easy
Of course, the road to finding the best technology between Power BI and Tableau is not easy, but we are here to help you go through some of the most important criteria and help you carefully choose the right one.
Learning and adaptability by business users
Tableau specializes in rich visualizations that can perform complex tasks with quick drag-and-drop functionality. It also offers some additional features as part of the package, but may need some help from IT to learn and implement them. If your business units rely heavily on the IT department for their analytics needs, then using Tableau can help you uncover some crucial business metrics.
Power BI is very easy to learn and pick up if your business users are already familiar with using other Microsoft business utilities. If your company is aiming for self-service business intelligence, learning and adapting to Power BI is quick and easy with a little help from IT for governance. In addition, Power BI offers many complex features and functionalities that can be used by your IT team for high-level enterprise-wide dashboards.
Data analysis and visualization capabilities
Power BI provides all the visualizations business users will ever need with an option to import custom visuals from the marketplace. It also offers machine learning capabilities with the availability of Azure Machine Learning Services.
Tableau offers its users an enhanced user interface experience with dynamic tooltip and Web page object functionality. The visualizations are very powerful and can display complex data. Users can also create additional, custom visuals using the choices available.
Presentation
This has to do with how each of these tools can handle large amounts of data. If your organization has a huge amount of data that extends to millions of rows or more, Tableau is the right choice. This also means investing in an IT team that manages and administers the data.
Power BI can handle no more than 10 GB of data and is a good solution for small to medium-sized businesses. This also means you can use it widely across all business units without having to involve IT.
Connectivity to data sources
Business users need to connect to a wide range of data types, including files, databases and online applications. Both Power BI and Tableau support a variety of data source connections, from native, live or extract.
While Tableau can connect to a wide range of servers and databases, Power BI offers other exclusive connectivity to the Microsoft ecosystem, including Azure and Power Apps services.
On-site or cloud deployment
Power BI offers both on-premises and cloud solutions to its users. Although users can use the free Power BI Desktop version for self-service business intelligence, more complex tasks, such as streaming analysis, natural language processing and alerts, are available in the cloud version of Power BI.
Tableau also offers on-premise and cloud solutions to its customers with the upper hand on its on-premise deployments.
If your company has a large amount of data stored on-premises, Tableau will give you the results you are looking for. On the other hand, Microsoft’s offering of Azure cloud makes it a better solution if you are looking for cloud analytics.
Cost
It depends on how many users you have. Both platforms offer free options that are great for learning and training your employees. The free learning resources will also help you get an idea of what would better suit your business.
Power BI starts at €8.40 per user per month.
Tableau starts at €70 per user per month.
Moreover, it depends on how many applications, the combination of applications and how many users will be working in the system. Overall, Tableau tends to be more expensive than Power BI, but it comes with support for big data sets, the increased availability of various visualizations and some other options that Power BI does not include. However, that price increase for Tableau via Power BI is really up to you to decide for your company based on what you want to do with your company’s data and whether you need that extra functionality.
As you can see, there are many different advantages and disadvantages to both business intelligence tools. In the end, it really comes down to what your organization currently has data-wise and what you want to achieve with that data.
Source: smartbridge
Want to know more?

Related
blogs


Tech Updates: Microsoft 365, Azure, Cybersecurity & AI – Weekly in Your Mailbox.