
Knowledge base
August 10, 2022
How to use Power BI in Outlook and Office to create data recovery
It is now easier to make decisions with your colleagues by putting Power BI data into PowerPoint slides and email messages.
If you want to drill down into your data and understand trends, outliers and the details of what’s going on, you want all the visualization and query options in Power BI. But when the time comes to explain that to someone else or use it to make a decision together, how do you show them the numbers?
The most common way people share and explain data is in PowerPoint presentations with graphs and charts or screenshots of a Power BI report. The problem is that you can’t dig into the data to see what’s going on, and it won’t be updated as new data comes in unless you do it yourself.
Adding Power BI reports to PowerPoint
The new Power BI data narration plug-in for PowerPoint lets you add fully interactive, live Power BI reports to a slide.
If you have a Microsoft 365 license and you are using the Office Insiders beta channel, the Power BI button will automatically appear on the Insert ribbon in PowerPoint. Click this to retrieve the Power BI temporary designation and paste it into the report URL.
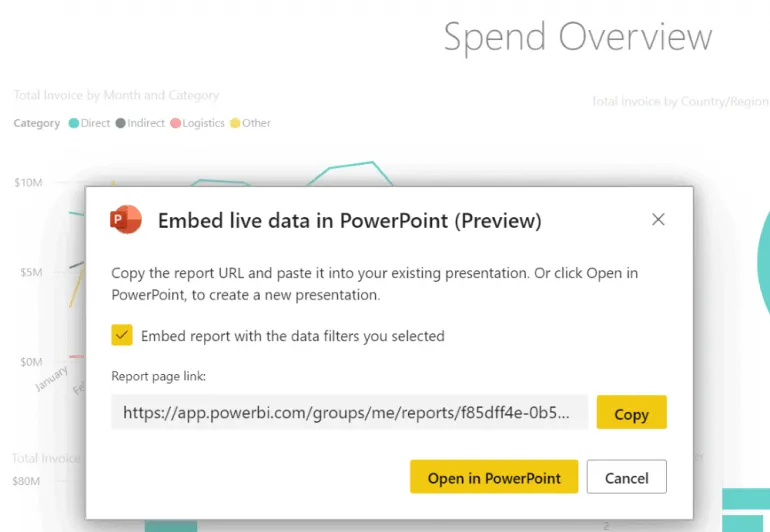
Choose Export > PowerPoint > Embed Live Data when you are in the Power BI report to retrieve the URL and click the Open in PowerPoint button in that dialog box if you want to create a new presentation with the URL in it. You can also use a filter or slicer first if you want a specific visualization from the report.
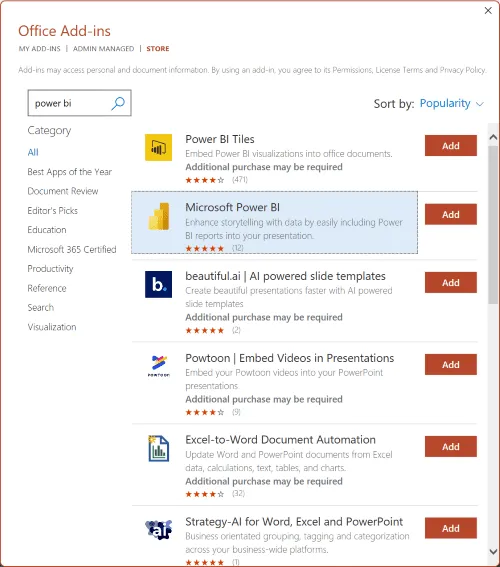
If you don’t see it and you have access to Power BI (even a free account that lets you view reports), choose Get Add-ons on the Insert tab and search for Microsoft Power BI(Figure A).
Dive into Power BI data and share it via PowerPoint
When you give a presentation, you can stop and dive into the Power BI data on your slide to answer questions with the same filters, slicers, and utilities you have in Power BI on the Web as long as you are online because the plug-in is a WebView2 control.
If you send the slides to someone, that person must have access to the Power BI report to view that slide. You can set that up when you use Sharing to retrieve the report URL(Figure B); if they don’t have access, they’ll just see a notification asking for access.
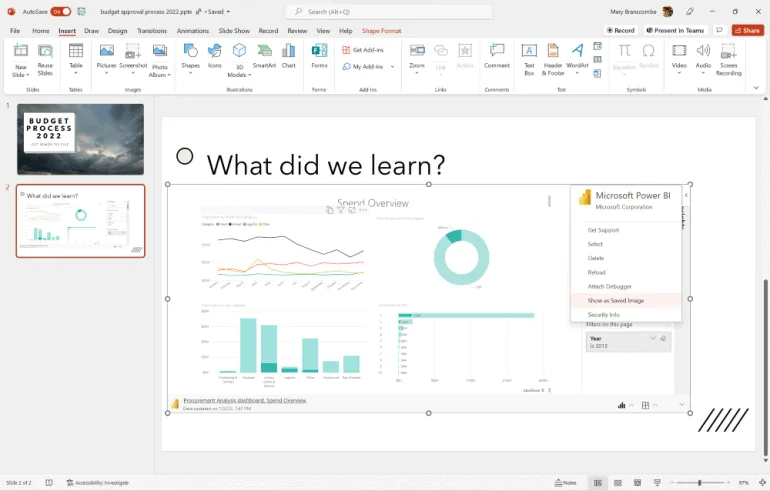
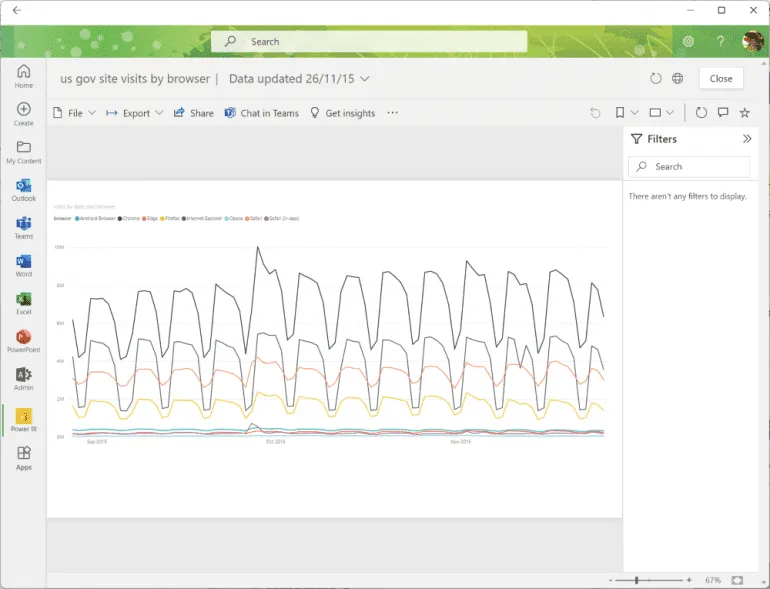
If you don’t want them to get the live data, you can click the arrow in the upper right corner of the insert and choose View as Saved Image. This makes it a static image, which is also useful if you need to give the presentation when you are not connected. However, you can click again to remove the checkmark from Display as Saved Image to retrieve the live data again(Figure C).
Setting up Power BI reports and alerts via email
Slides are not the only place we should use data to ask questions or explain what we plan to do. Although you can link to Power BI in Teams, a feature that will soon be integrated into mobile Teams, many people still have conversations and share information via email, especially to send regular status reports. Fortunately, there are several ways to use Power BI with Outlook.
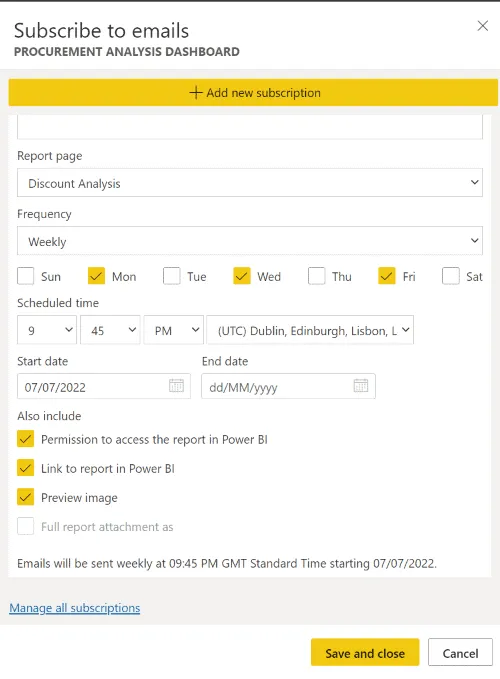
When you share Power BI reports and dashboards using the Share button on the service, you can email a link. Keep in mind that people outside your organization can see reports, but cannot edit them. You can also subscribe to snapshots of Power BI reports and dashboards by email if you have a Power BI Pro or Premium license. Click Subscribe in the toolbar(Figure D), enter your email address (or someone else’s) and choose how often you want to send the email.
If you want to email a report when something changes instead of at regular intervals, set up Power BI data alerts and choose Use Microsoft Power Automate to trigger additional actions.
If you want to send Power BI reports as attachments by email on a regular basis, you can automate that with Power Automate. Create a catchment area and set how often you want to send the reports and in what format (such as PDF) you want to send them.
Opening and creating Power BI reports in the Office Hub
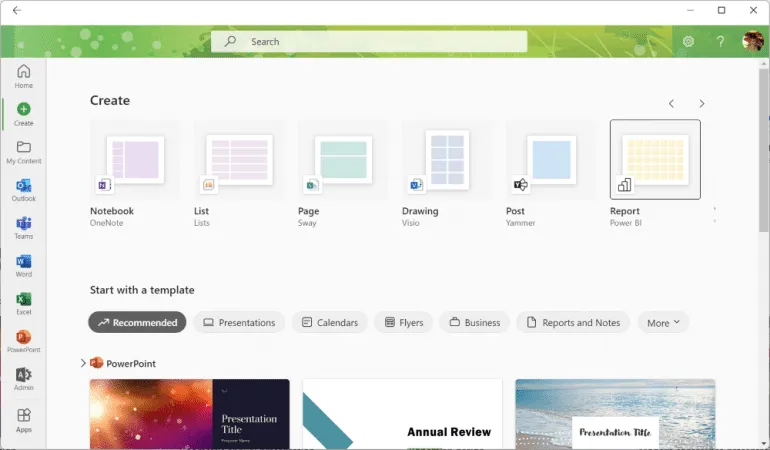
Having Power BI as a separate service with its own website means that it is not the same as using the other Office applications. The Office hub, which is both the office.com website and an app on your PC, now includes Power BI reports in the list of documents you can create, alongside Visio drawings and familiar Office documents(Figure E). You can also add the same Power BI app you use in Teams to the list of apps displayed there, such as Outlook.
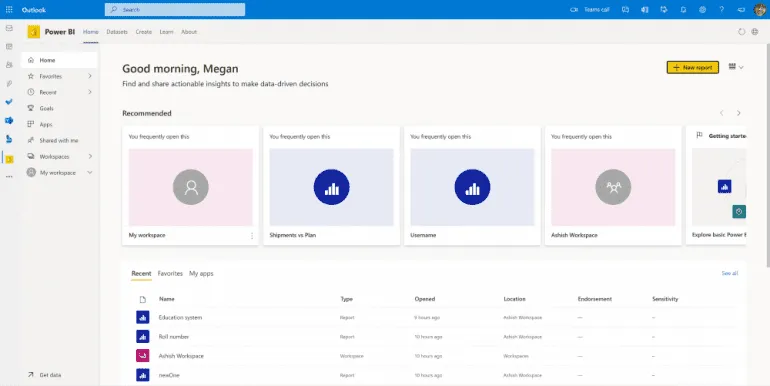
If you currently create a new report from the Create list, it will open in your browser, but Microsoft says this will change. If you start with the change from the Power BI app in the Office hub app and create a new report, you will stay there(Figure F).
Using Power BI in Outlook
If you are using the web version of Outlook or Windows and you have installed the Power BI app in Teams, the Power BI app will also appear in the Outlook navigation along with Microsoft To Do, Yammer, and Bookings(Figure G). This is being rolled out as part of Microsoft 365 First Release for Outlook web and Office Insiders Beta Channel for Outlook on Windows, but that may take some time to reach everyone, even if other people in your tenant already have it.
Allows you to explore reports and dashboards without having to switch to another application. Right-click if you want to open that in a new window instead of switching views.
In the future, when someone emails you a link to a report or dashboard, it will open in the Power BI app in Outlook instead of opening a new web page, but that won’t work in the current preview. Currently, you also cannot export or download files, paste data, or view content in full screen, so if you need to do that, you can click on the globe icon in the Power BI app to go to the web version.
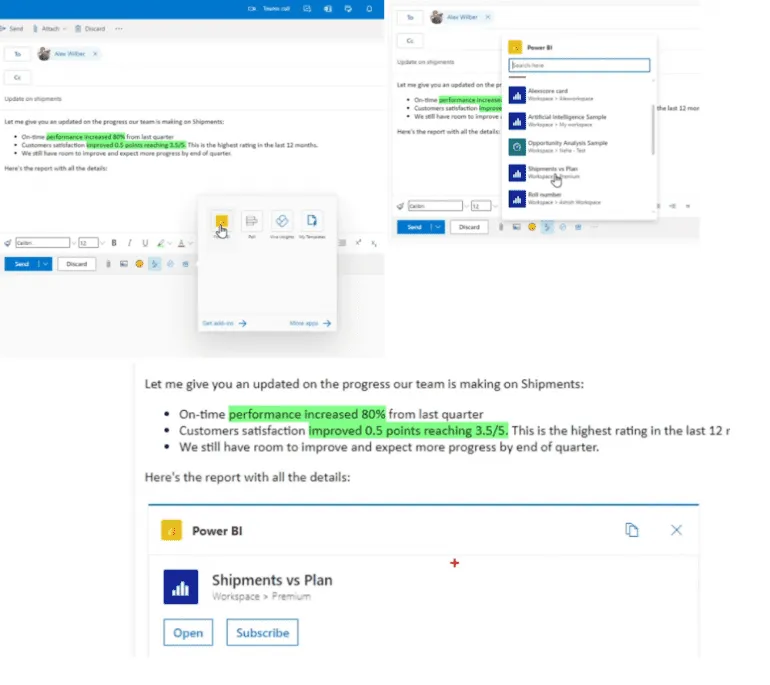
But having Power BI in a second window or tab, even if it is more convenient to go to a separate website, is not integrated into the emails you write. When you download the Power BI app into Outlook, you can insert a report into an email as if you were attaching a file(Figure H), with a similar selector that displays the reports and dashboards you’ve used recently. And this allows you to search for those who do not appear in the list. However, that doesn’t include the report in the email; what you get is an Adaptive Card, which Microsoft now calls Preview Cards.
Further down the line, pasting in the URL of a Power BI report will also create a preview map that Microsoft calls “unfolding,” and it looks a bit like the smart paste options in Office documents. The idea is that instead of a URL that can go anywhere, the person you send it to sees the name of the report and where it is located in Power BI, so they know it’s official data relevant to the discussion, because the data won’t help if people don’t trust it.
Source: techrepublic
Want to know more?

Related
blogs


Tech Updates: Microsoft 365, Azure, Cybersecurity & AI – Weekly in Your Mailbox.